
Corner kick outcomes in elite association football are rarely accidental byproducts of general dominance; rather, they reflect precise spatial philosophies and deliberate systemic friction between opposing systems. During the 2009/10 Spanish La Liga season, extreme strategic divergences emerged between teams funneling possession into wide zones and those executing patient, central penetration. Market lines on corner totals frequently failed to account for these distinct spatial interactions, pricing matches simply on overall attacking pedigree rather than the structural mechanisms that actually deflect balls across the byline.
Why Possession Superiority Misleads Corner Projections
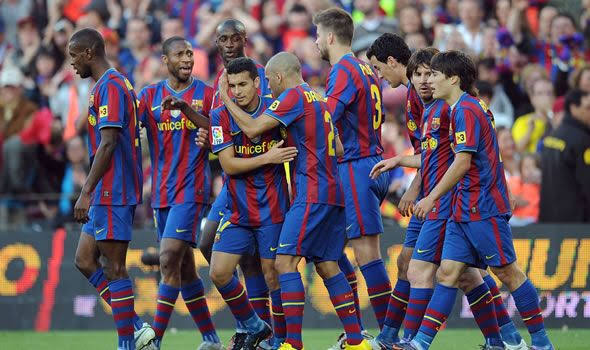
Mainstream handicapping habitually equates territorial control with corner creation, yet Spain’s tactical landscape in 2009/10 demonstrated that high-possession models can actively suppress corner counts. Pep Guardiola’s Barcelona averaged supreme territorial control and scored ninety-eight goals, yet their structural objective was patient, interior combination play rather than perimeter crossing. By restricting wingers to inverted channels and prioritizing cut-backs toward the penalty spot over high crosses into crowded boxes, their matches frequently suppressed defensive deflections, yielding total corner numbers well beneath traditional European top-tier averages.
Conversely, clubs operating with lower overall possession metrics often manufactured disproportionately high corner counts due to aggressive touchline adherence. When a team’s forward progression depends on orthodox wingers driving directly to the endline against compact central blocks, clearances naturally skip off sliding defenders or are pushed out by goalkeepers parrying crosses around the posts. The fundamental origin of corner volume is not the volume of attacking possessions, but the angle and terminal destination of the final pass within those sequences.
Team Profiles Built for the Over: Pure Width and Aerial Targets
Teams that repeatedly sustained profitable returns in over-corner markets combined high cross frequency with target-forward archetypes who demanded direct service. Athletic Bilbao, managed by Joaquín Caparrós, stood as the benchmark for this profile. Their tactical system was designed to leverage the physical aerial dominance of Fernando Llorente, instructing wide midfielders and advancing full-backs to deliver deliveries into the penalty box at the earliest feasible opportunity.
This direct verticality routinely confronted deep-seated defensive blocks that preferred deflecting crosses behind the goal rather than conceding aerial duels in high-danger zones. A detailed inspection of match-level volume profiles illustrates how stylistic traits dictated baseline corner production across the division.
| Club | Primary Attacking Vector | Average Corners Won / Match | Average Corners Conceded / Match | Natural Line Tendency |
| Athletic Bilbao | High-volume crossing to aerial focal point | 6.42 | 4.68 | Consistent Over on 10.0–10.5 |
| Sevilla FC | Overlapping full-backs, direct flank isolations | 6.18 | 4.21 | Over against deep blocks |
| Real Madrid | High-velocity transitions, dynamic long-range shooting | 6.89 | 3.84 | High totals driven by self-production |
| FC Barcelona | Central interior triangles, low cut-backs | 5.82 | 2.65 | Systematic Under against low blocks |
| CA Osasuna | Compact central containment, low-risk clearances | 3.95 | 4.82 | Consistent Under on 9.5–10.0 |
Examining these aggregate profiles confirms that corner generation was largely decoupled from net league position. Real Madrid and Sevilla generated massive counts through individual dribbling volume and rapid counter-attacks along the perimeter, whereas Osasuna’s refusal to over-commit wide players systematically restricted total corner frequencies on both ends of the pitch throughout ninety minutes.
Defensive Geometries That Suffocate Wide Deflections
Selecting under-corner outcomes required identifying tactical configurations engineered to deny byline access entirely. In 2009/10, managers facing overwhelming technical opposition often deployed a narrow 4-4-2 or a 5-3-2 low block, positioning their wide midfielders strictly inside the half-spaces. This defensive geometry invited attacking teams to circulate possession harmlessly forty yards from goal while systematically walling off the touchline routes where deflections happen.
When two teams utilizing this conservative interior structure clashed, such as an encounter between Osasuna and Espanyol, play inevitably bogged down in congested central midfield battles. Turnovers occurred predominantly in the middle third through missed ground passes or aerial midfield duels rather than desperation goal-line interventions. Bettors backing high corner lines under the assumption that intense, gritty relegation battles produce frenetic set-piece counts were repeatedly trapped by matches characterized by long sequences of neutral midfield stagnation.
Tactical Triggers That Drive Endline Clearances
The mechanical generation of corner kicks relies on specific defensive and offensive actions converging along the terminal boundaries of the pitch. Understanding these on-pitch interactions clarifies why certain stylistic pairings inevitably produce sustained sequences of consecutive set-pieces.
- Touchline-Locked Full-Back Overlaps: Attacking schemes where full-backs overlap past inverted wingers force secondary defenders to execute sliding blocks on low crosses, directly sending balls over the endline.
- Low-Block Aerial Vulnerabilities: Defending units lacking height in the center of their defense deliberately surrender corners rather than allowing open wide crosses into the six-yard box.
- Aggressive Long-Range Parries: High shooting volume from outside the eighteen-yard box, especially against goalkeepers lacking command of their rebounds, generates upward palm-offs and deflections over the bar.
- Emergency Clearances Under Pressure: Fast transition counters that hit isolated two-on-two defensive setups force center-backs to make horizontal sliding recoveries that naturally ricochet wide of the net.
Dissecting these operational mechanics explains why corner counts frequently cluster in short, intense bursts rather than spreading evenly across halves. When an attacking side secures an initial corner, their subsequent set-piece routine often yields a secondary deflection from an unbalanced defending unit, multiplying the overall tally within a three-minute window.
Cross-Matching Opponents: The Flank-vs-Flank Interaction
A high-corner side cannot manufacture totals entirely in isolation; their output depends heavily on the spatial allowances offered by the opposition. When an attacking team with elite wide volume encounters an opponent that employs aggressive wing-backs without defensive wing support, the open real estate on the counter-flank guarantees persistent reaching tackles and contested byline recoveries.
Conversely, if an attack that depends on perimeter crossings meets an opponent utilizing disciplined, deep double-teams along the touchline, the crossing delivery is frequently snuffed out thirty yards out rather than at the corner flag. In these scenarios, the turnover results in a throw-in or a central counter-press rather than an endline deflection, collapsing the projected set-piece totals well below market benchmarks.
Under specific pre-match circumstances where starting team selections reveal narrow diamond midfields paired with defensive full-backs who refuse to cross the halfway line, quantitative signals point decisively toward an under. Monitoring how these structural alignments alter expected corner counts is standard protocol across any advanced betting platform, where sophisticated derivative markets adjust line thresholds from 10.5 down to 9.0 the instant tactical starting lineups confirm a complete absence of natural wingers.
Game-State Mechanics: Chasing Scenarios Versus Comfortable Leads
Corner creation is exceptionally sensitive to game state, making pre-match projections vulnerable if the opening goal arrives too early. When an aggressive, high-volume attacking team falls behind early to an underdog, the tactical posture of both teams polarizes completely. The trailing favorite pushes ten men into the final third and repeatedly peppers the box with crosses, shots, and hurried deliveries, whereas the defending underdog sinks into an emergency shell on the edge of their six-yard box.
In these chasing dynamics, corner counts escalate exponentially. The defending side ceases any attempt to control transition possession, opting instead for maximum-safety clearances that consistently gift dead balls. If that exact same favorite scores inside the opening ten minutes, however, the dynamic inverses. The leading team dials back its territorial aggression, opting to preserve stamina through low-risk lateral passing, while the trailing underdog often lacks the technical apparatus to mount a wide assault of their own, freezing the corner tally for long stretches.
Analyzing the volatile, continuous fluctuations of match momentum demands a discipline rooted in observed spatial reality rather than blind luck. While non-sporting gambling spaces characterized by an interactive casino online rely entirely on immutable, pre-programmed random number algorithms, football corner analysis rewards the real-time identification of tactical urgency, physical exhaustion, and match-state asymmetry.
Tactical Shifts and In-Season Adjustments
Over the course of thirty-eight matchdays, tactical philosophies rarely remain completely static, introducing regression points for corner handicappers. A mid-season coaching replacement or a long-term injury to a vital wide player can entirely dismantle a team’s corner-production metrics overnight. In 2009/10, when injuries forced certain sides to alter their shape from a wide 4-4-2 to an interior 4-2-3-1, their offensive mechanics shifted from wide crossing to direct interior through-balls, instantly reducing their weekly corner creation.
Market lines typically exhibit significant lag in adjusting to these structural transformations, relying instead on trailing ten-game moving averages that carry the weight of an obsolete tactical system. Savvy analytical observers who recognized that a club had lost its primary crosser or had transitioned to an interior target-man setup were able to capitalize on inflated corner lines before oddsmaking algorithms recalibrated to the team’s reduced perimeter width.
Sharp pricing anomalies often persist in specialized set-piece totals until substantial volume forces an adjustment. Whenever an analytical bettor identifies a discrepancy where a cross-heavy team encounters a deep, narrow defense, monitoring price movement through ufabet168 highlights how professional market syndicates actively buy into over lines before standard retail books recognize the impending mismatch.
Summary
Accurately evaluating over and under corner opportunities throughout the 2009/10 La Liga campaign required dismantling the conventional wisdom that overall team quality correlates linearly with set-piece generation. Teams like Athletic Bilbao, Sevilla, and Real Madrid consistently rewarded high corner totals because their mechanical approach relied heavily on wide isolation, high-volume crossing, and frequent direct shooting from range that forced goalkeeping deflections.